Saturday, October 28, 2023

Mastering the Market with Mark Minervini's VCP Technique


In the ever-evolving world of stock trading, finding a strategy that consistently delivers results is akin to discovering a hidden treasure. One such gem in the realm of stock market strategies is the VCP (Volatility Contraction Pattern) technique, popularized by renowned trader Mark Minervini. In this blog post, we'll delve into the essence of the VCP pattern, exploring its principles and understanding how it empowers traders to navigate the market with confidence.

Understanding the VCP Pattern

At its core, the VCP pattern is a method used by traders to identify potential breakout stocks. It revolves around the concept of volatility contraction, where a stock's price movements gradually stabilize, forming a distinct pattern resembling the letter 'V.' This pattern signifies a period of consolidation and accumulation, indicating that the stock is gearing up for a significant price surge.

Key Components of the VCP Pattern

1. Volatility Contraction: The hallmark of the VCP pattern is the gradual reduction in price volatility. This period of stability suggests that institutional investors are quietly accumulating shares without causing drastic price fluctuations.

2. Volume Confirmation: As the stock price stabilizes, watch for a decrease in trading volume, indicating reduced selling pressure. A subsequent increase in volume during the breakout validates the pattern, signaling strong buying interest.

3. Price Tightness: The VCP pattern is characterized by tight price action near the pattern's base. This tightness reflects a balance between buyers and sellers, creating a launching pad for potential upward movement.

Implementing the VCP Technique

1. Stock Selection: Identify stocks displaying strong fundamental indicators, such as robust earnings growth, innovative products, or a unique market position. These stocks are more likely to exhibit the VCP pattern.

2. Chart Analysis: Utilize charting tools to identify the VCP pattern. Look for a series of narrow price ranges and decreasing volatility, indicating the stock's consolidation phase.

3.Confirmation Signals: Wait for the breakout confirmation. This occurs when the stock price convincingly breaches the pattern's upper boundary with a surge in trading volume. This validates the pattern and serves as a green light for potential entry.

Benefits of the VCP Pattern

1. Timely Entry: The VCP pattern helps traders enter positions at optimal moments, maximizing profit potential during price uptrends.

2. Reduced Risk: By entering trades during periods of consolidation, traders can set tighter stop-loss levels, reducing potential losses if the trade doesn't go as planned.

3. Market Adaptability: The VCP technique is versatile and applicable across various market conditions, making it a valuable tool for traders in different scenarios.

Incorporating Mark Minervini's VCP technique into your trading strategy can provide a structured approach to identifying high-probability trades. Remember, while historical patterns can offer insights, it's crucial to combine them with thorough research and analysis to make informed trading decisions. With diligence, patience, and a keen eye for patterns, traders can leverage the power of the VCP technique to unlock the doors to profitable opportunities in the stock market.


Courtesy : Various Books of MM and YT

Cheers Chirag CM

Self Note for Unlocking Excel Sheet

I was tired of searching this code on internet every now and then. So added here as a note.


Sub PasswordBreaker()


Dim i As Integer, j As Integer, k As Integer
Dim l As Integer, m As Integer, n As Integer
Dim i1 As Integer, i2 As Integer, i3 As Integer
Dim i4 As Integer, i5 As Integer, i6 As Integer

On Error Resume Next
For i = 65 To 66: For j = 65 To 66: For k = 65 To 66
For l = 65 To 66: For m = 65 To 66: For i1 = 65 To 66
For i2 = 65 To 66: For i3 = 65 To 66: For i4 = 65 To 66
For i5 = 65 To 66: For i6 = 65 To 66: For n = 32 To 126
ActiveSheet.Unprotect Chr(i) & Chr(j) & Chr(k) & _
Chr(l) & Chr(m) & Chr(i1) & Chr(i2) & Chr(i3) & _
Chr(i4) & Chr(i5) & Chr(i6) & Chr(n)
If ActiveSheet.ProtectContents = False Then
MsgBox "One usable password is " & Chr(i) & Chr(j) & _
Chr(k) & Chr(l) & Chr(m) & Chr(i1) & Chr(i2) & _
Chr(i3) & Chr(i4) & Chr(i5) & Chr(i6) & Chr(n)
Exit Sub

End If
Next: Next: Next: Next: Next: Next

End Sub


Cheers Chirag CM

Thursday, May 8, 2014

COAL ON SELL IF NOT SUSTAIN 300 MARK


We are giving a sell call on COAL INDIA if it does not closed above 300 - 303 range here is the
graph for you and the target is 287 285.

Here are the important levels for the Coal
UP         300 303 307 312 315
DOWN 292 289 287 285 282


COAL ON CALL FOR SELL IF NT SUSTAIN 300 MARK


Cheers Pratik JM

Monday, May 5, 2014

BHARAT FORGE MAKE OR BREAK LEVEL........


The important levels are as follows
Most crucial 400 and 398 if it close below this level it may fall to 387 level and if it break the given channel then major fall we can see
up side  405 408 410 413 415
down side 401 398 395 392 387
If anyone want to trade if it trades below channel that value is 400 level with volume then short it and vice-varsa.


CheersPratik JM

ALLHABAD BANK WILL FIRE ABOVE 104-105 ON CLOSING BASIS


Here is the stock for the day ALLBANK if it will close above 104-105 and will reach to 112-118 with in a week.... here is the graph.....


Pratik Maniyar
Thanks.

Sunday, May 4, 2014

Now we are available to give you best trading ideas- 200 Moving Average Idea


After a long time I am not writing the blog but now I am available with more analysis on stock and give you a crystal clear analysis of stocks with targets for short term and long term.

I read some books and I want to share with  you some knowledge from the books that I read so that all of you can understand the some important point its related to 200 DMA.

Stocks are purchased when a broad market benchmark is above its 200-day moving average, and stocks are sold when the market benchmark falls below its 200-day moving average. Though there are variations in the type of the moving average used, the basic premise is the same: Own stocks when the market is above the indicator and sell stocks when the market is below it.

In his new fifth edition of “Stocks for the Long Run” (McGraw-Hill, 2014), Jeremy Siegel looked at whether this strategy is beneficial. He ran the numbers from 1886 through 2012 using the Dow Jones industrial average. He applied a 1% band, meaning the Dow had to be at least 1% above its 200-day moving average to trigger a buy signal or at least 1% below its 200-day moving average to trigger a sell signal. The band is important because it reduced the number of transactions. Without it, an investor would be frequently jumping in and out, driving up transaction costs in the process. Siegel also assumed end-of-day prices were used.

Following the 200-day moving average timing strategy would have kept an investor out of the worst market downturns. Specifically, the investor would have avoided the large losses endured during both Black Tuesday (October 29, 1929) and Black Monday (October 19, 1987). The strategy would have also helped the investor avoid the 2007-2009 bear market.

Commenting on the results, Siegel observed, “The timing strategist participates in most bull markets and avoids bear markets, but the losses suffered when the market fluctuates with little trend are significant.” He added, “The timing strategy involves a large number of small losses that come from moving in and out of the market.”

Jeremy’s calculations show the 1886-2012 annualized return from the timing strategy dropping from 9.73% to 8.11% once transaction costs are factored in. In contrast, the buy and hold strategy realized a 9.39% return. If the 1929-1932 crash is excluded, the buy and hold strategy looks even better: A 10.6% annualized return versus annualized returns of 9.92% and 8.38% for the timing strategy (without and with transaction costs, respectively).

One advantage the 200-day moving average timing strategy did have was reduced risk. With the exception of 1990-2012, the timing strategy incurred less risk than the buy and hold strategy for every period and subperiod studied. This is due to the avoidance of the market’s big downward drops.

There is one consideration not factored into Siegel’s analysis: investor psychology. If an investor lacked cold-as-steel nerves and either failed to sell or buy stocks when triggered, the timing strategy’s performance would be much worse. This is because by not acting appropriately, the investor would have missed out on the benefits the strategy was designed to provide.

This is the inherent problem with all trading strategies. An investor who is psychologically unable to stick with them during turbulent market conditions is always better off with a buy and hold strategy. It does not matter how well a trading strategy has performed in the past; if an investor cannot stick to it in all market conditions, his portfolio will suffer. A simple formula to remember is portfolio return equals strategy performance less transaction costs and behavioral errors. A sound strategy that incurs the lowest combination of transaction costs and behavioral errors is the one that will allow you personally to realize the largest long-term gains.


 Hope this will helps you for the future.


Thanks,
Cheers Chirag CM .

Monday, April 22, 2013

GIC Housing Finance_A good buy


GIC Housing Finance can give a good move above 115. One can buy it above 115. It can move till 126.


Cheers
Chirag CM

Monday, March 18, 2013

CASTROL- at a crucial level


CASTROL is again around 330 levels. A close above 336 would open a new way to upside.

Cheers
Chirag CM

Monday, December 17, 2012

HINDALCO Can it break-out this time..??


HINDALCO is again at 124 level and if it closes above 126 it can give a good move.

Cheers
Pratik.

Thursday, December 6, 2012

GIC HOUSING FIN...Breakout?


GIC Housing Finance has created multiple tops around 124 levels. Today it has closed above it's resistance of 125. One can enter the stock for a good 10 Rs. move with the stop loss of 125.

Cheers
Chirag CM

Tuesday, October 23, 2012

Friday, September 7, 2012

EMAMILTD.. Will it come out from rectangle range?


EMAMILTD is trying to break its rectangle range. Above 508 it can be a good bet.

Cheers
Chirag CM

Tuesday, August 28, 2012

Archies..A breakout on cards?


Archies can be a good buying opportunity above 25.50 as 200DMA is somewhere around 25.50 which is y'day's close. Above this it may show some quick moves.

Cheers
Chirag CM

Monday, August 27, 2012

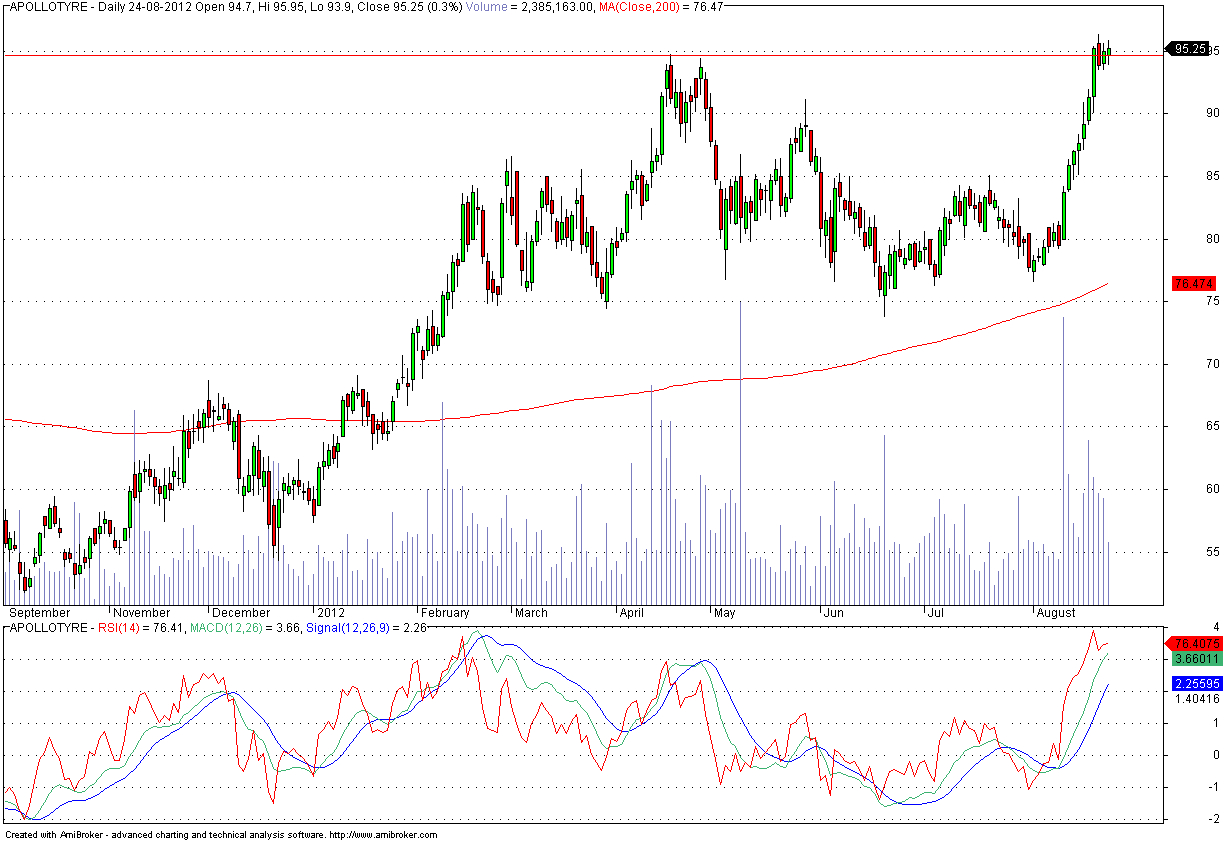
Apollo Tyre.. A good move expected


APOLOTYRE has set for a good move upside giving a lifetime high close. A long position can be taken above 95 for a quick move to 102.


Cheers
Chirag CM

Thursday, August 2, 2012

Waiting for OIL INDIA to cross 500-505


I was randomly checking few charts week ago and found OIL INDIA interesting. It is a good bet above 505 levels but still it is hovering around 490-95 levels.

Cheers
Chirag CM

Monday, June 25, 2012

On verge of break out and inverse H&S as well EMAMI LIMITED


All FMCG stocks are working as defensive and main FMCG stocks like ITC and HUL are reaching at 52 week high so this is fresh and no one looking into EMAMI and now punters are going to bet on EMAMI.


If the stock is closed above 491 with some volume than it clearly show that it will zoom up to 513 and then 529 so keep close watch on this and stop loss is 474 on closing basis and if it close above 531 than add another 23 to 30 rupees.


Another call on PIRAMAL HEALTHCARE sell with the stop loss of 525 with the target of 491 482.

Cheers Chirag CM

Friday, June 8, 2012

Reliance... A short term channel breakout


Reliance has given a short term range breakout above 720. It can move up by 25 rupees from here.

Cheers
Chirag CM

Friday, April 13, 2012

Dena Bank..Technical Analysis


Dena bank has came out from it's trading range which it was forming from past 2 month or so. A scrip good to watch now....


Cheers
Chirag CM