Monday, December 17, 2012

HINDALCO Can it break-out this time..??


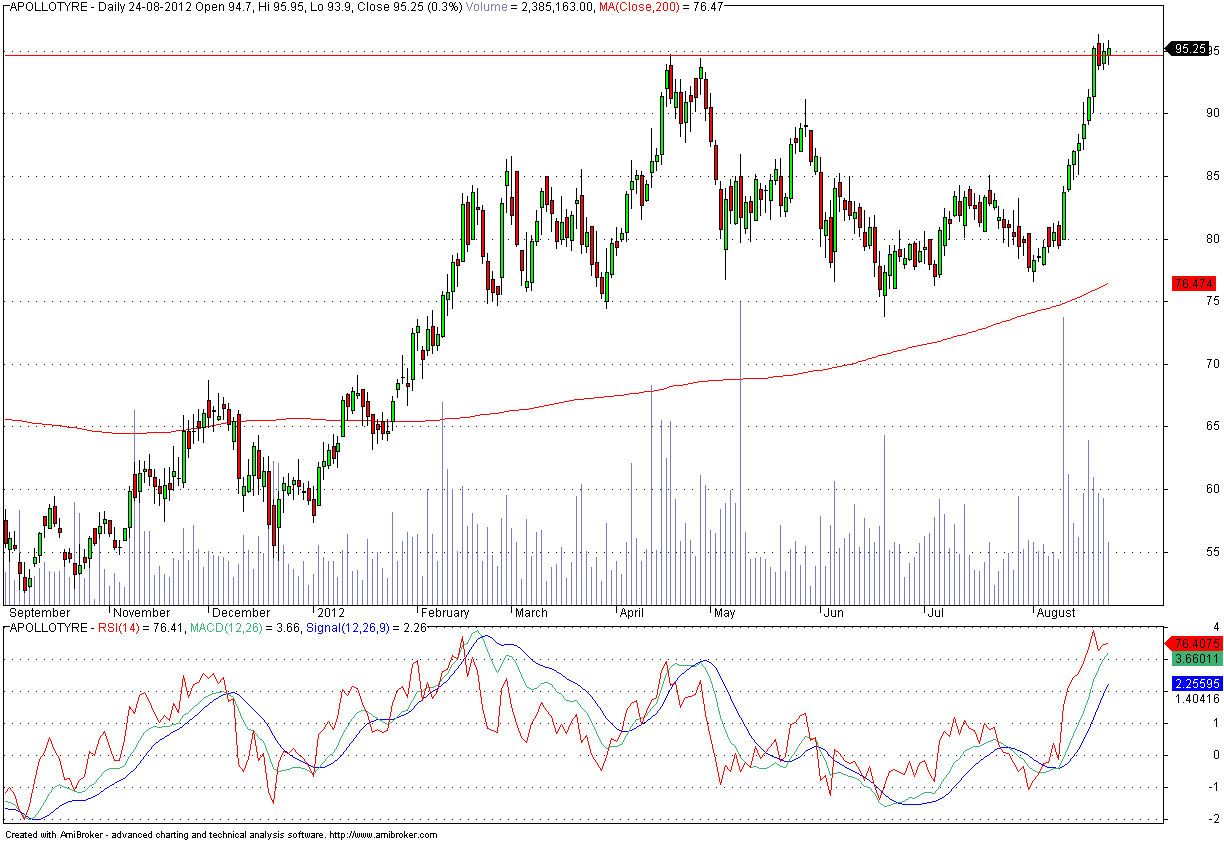
HINDALCO is again at 124 level and if it closes above 126 it can give a good move.

Cheers
Pratik.

Thursday, December 6, 2012

GIC HOUSING FIN...Breakout?


GIC Housing Finance has created multiple tops around 124 levels. Today it has closed above it's resistance of 125. One can enter the stock for a good 10 Rs. move with the stop loss of 125.

Cheers
Chirag CM

Tuesday, October 23, 2012

Friday, September 7, 2012

EMAMILTD.. Will it come out from rectangle range?


EMAMILTD is trying to break its rectangle range. Above 508 it can be a good bet.

Cheers
Chirag CM

Tuesday, August 28, 2012

Archies..A breakout on cards?


Archies can be a good buying opportunity above 25.50 as 200DMA is somewhere around 25.50 which is y'day's close. Above this it may show some quick moves.

Cheers
Chirag CM

Monday, August 27, 2012

Apollo Tyre.. A good move expected


APOLOTYRE has set for a good move upside giving a lifetime high close. A long position can be taken above 95 for a quick move to 102.


Cheers
Chirag CM

Thursday, August 2, 2012

Waiting for OIL INDIA to cross 500-505


I was randomly checking few charts week ago and found OIL INDIA interesting. It is a good bet above 505 levels but still it is hovering around 490-95 levels.

Cheers
Chirag CM

Monday, June 25, 2012

On verge of break out and inverse H&S as well EMAMI LIMITED


All FMCG stocks are working as defensive and main FMCG stocks like ITC and HUL are reaching at 52 week high so this is fresh and no one looking into EMAMI and now punters are going to bet on EMAMI.


If the stock is closed above 491 with some volume than it clearly show that it will zoom up to 513 and then 529 so keep close watch on this and stop loss is 474 on closing basis and if it close above 531 than add another 23 to 30 rupees.


Another call on PIRAMAL HEALTHCARE sell with the stop loss of 525 with the target of 491 482.

Cheers Chirag CM

Friday, June 8, 2012

Reliance... A short term channel breakout


Reliance has given a short term range breakout above 720. It can move up by 25 rupees from here.

Cheers
Chirag CM

Friday, April 13, 2012

Dena Bank..Technical Analysis


Dena bank has came out from it's trading range which it was forming from past 2 month or so. A scrip good to watch now....


Cheers
Chirag CM

Monday, April 9, 2012

Amar Remedies: A breakout.


Amar Remedies has given a superb breakout with good volumes. It has thrashed its previous highs which were made in early Feb. Stock has potential to go 20 more bucks up.

One can initiate the trade considering 154 as a strict stop loss.

Cheers
Chirag CM

Thursday, April 5, 2012

Castrol..Inverse Head & Shoulder Pattern


A superb IHNS formed by CASTROL in recent days. Continuation of this rally may lead stock up to 580 levels.

Cheers
Chirag CM

Monday, April 2, 2012

Candlestick Patterns- Part -1

Even though the structure of candlesticks is different from that of bar charts, it is easy to combine candlesticks with the technical chart analysis. By focusing on the relationship between open and close prices, candlesticks show how market forces change during market hours. This often indicates the short-term momentum in different products or markets. 


Candlestick charts are based on the same market data as regular bar charts but present that data in a different way. The components of candlestick charts are the opening price level, the closing price level, the high price, and the low price of any data compression rate, be it weekly, daily or intraday data.


I've found one interesting video which is very interesting at the basic level.


I will try to include more insights in Candlestick pattern.


Cheers
Chirag CM

Wednesday, March 14, 2012

Reliance..A Fight to cross 200 DMA

Reliance is trading at 820 which is also its 200 DMA. Generally 200 DMA is considered as long term entry and exit level. 


"The 200-day moving average is perhaps the most popular. Because of its length, this is clearly a long-term moving average. If price is above the 200-day moving average, chartists would consider it as a bullish sign and vice versa."

Though reliance has crossed its 200 DMA in early February but was unsuccessful to sustain it. Again the time has come for Reliance to show its metal. Good move can be expected above 820.  

Raymond:

Raymond can be a good buy at the current levels as it has given a much awaited breakout this time. The stock was trying to breach this level since Dec. '10. If it sustains above 405-07 then once can expect a good move.


Have a happy trading.

Cheers 
Chirag CM

Friday, March 9, 2012

NIFTY- Technical Analysis


Nifty may show some sign of reversal in upcoming days. Below are the reasons:


  • 200 DMA is at 5165 while 50 DMA is at 5135 and both are considered as major supports.
  • If small MA crosses long MA then it will be considered as bullish sign. Will it happen in case of NIFTY?
  • After 5 red candles one reversal green candle was formed by it in last trading day.
Please share your views on this.

Follow me on twitter. @ccmoradia


Cheers
Chirag CM

Thursday, March 8, 2012

Finally a breakout..Lupin


Lupin has finally given a breakout level of 490. It is also trading at 52 weeks high. It has tried to breach the same level few times before but couldn't succeed.

One can enter the stock at current levels with the immediate stop of 485 with the target of 534.

Happy Investing.

Follow me on twitter @ccmoradia

Cheers
Chirag CM

Monday, February 13, 2012

Random Watch--Dish TV


Dish TV given a break-out above its trendline of 65-66. It can be a good buy above it.

Cheers
Chirag CM

Thursday, February 2, 2012

Amar Remedies....A Technical view

Amar remedies has given new 52 weeks high. Along with this it has also given a good breakout with volumes. One can enter it with immediate stop loss of 138 with the first target of 147. After that it has fuel to fetch 20 more bucks.


Cheers
Chirag CM

Wednesday, January 25, 2012

Aurobindo Pharma & HCLTECHNO...Decisive moves ahead

Aurobindo Pharma:

Aurobindo Pharma has short term decisive move ahead. After giving super breakout from its consolidation zone and 50 days DMA it has came back again to test it after making high of 110. One can enter it around current levels with the first SL around 96 & the ultimate SL of 92.


2) HCLTECHNO:

HCLTECHNO has given the highest closing after 15-11-2011. Couple of consecutive closes above 425 will open doors for 445 which is its 200 DMA and then after it may try to fill the wide gap till 463.


CAIRN & CIPLA have given a good moves yesterday by respecting to their trend-lines. Good moves can be expected ahead.


Cheers
Chirag CM

Tuesday, January 24, 2012

Here are the two stocks which are looking very attractive on weekly as well as daily charts.....

1}CIPLA:

Cipla has given a good move yesterday and it has already breached its earlier resistance of 333, now at 342. It has very good short term support around 337. This move may continue till it holds 337 to 333. The move may continue to 349 and to 353. 353 will act as a major hurdle. Here's the chart.


2} CAIRN:


Cairn is looking can be added to watchlist as it can give good move above 351. Below is the chart.


Cheers
Chirag CM

Friday, January 20, 2012

LIC housing finance A pullback buy.

LIC housing finance has given a good breakout above 240 levels and it went upto 253. Now it has came back to test breakout level of 240 with the close at 245. It can be a good buying opportunity at this level with the stop loss of 240.

A move of 30 bucks can be expected.


Cheers
Chirag CM

Thursday, January 19, 2012

ICICI Bank...Will it take support?


ICICI bank has tried to break its resistance line around 795 but came back in last session. Now the support falls around 745. The price looks good to enter as it is it's 50 DMA. Below is the chart for ICICI.


One can enter the position around 750 levels with the stop of 740-35.


Tuesday, January 17, 2012

Reliance Ind. Technical view


Here's the chart for Reliance Ind. It is nicely poised and one can enter it around 695 levels as it seems a good buy points. It was hammered heavily in recent times but can come back sharply. It market supports then first target will be around 750.


Cheers
Chirag CM

Thursday, January 12, 2012

Fundamental stock picking

Below are the few parameters which are very useful in stock picking in
fundamental way

Earnings per share (EPS);
Net Sales; Book Value per share (BVPS);
Return on Invested Capital (ROIC); and,
Debt-to-Net Profit ratio.

Seen together and over 10 years these 5 reveal the truth. Let's see how!

The truth-revealing 5 Financial parameters

What is the first thing that you will look for in a company before
investing? You will check whether it is making Profits, consistently!
Since we will be shareholders, we need to look at the profit it earns
per share . Hence the first parameter to look for is EPS – Earnings
per Share.

How can a company continue to earn profitsyear after year? By selling
more and more every year. Hence, the second parameter tolook for is
Net Sales.
To increase its sales in the long run, a company will need to expand
its capacity.

Book Value per Share, BVPS tells us how much a company is investing in
expanding its capacity. That's the third parameter.
Companies in the most basic sense are money-using and money-making
machines. How do we rate a machine? Simple, we look at what it
produces in relation to what it uses i.e. efficiency.

Companies produce profits using the capital invested (both equity and
debt). Hence to know the efficiency with which a company uses its
capital, we need to look at Return on Invested Capital (ROIC). That's
the fourth parameter

Finally, if a company borrows money, it should be able to repay it
without serious difficulty over a reasonable period of time.
Debt-to-Net Profit ratio tells us the number of years in which the
company will be able to repay the debt. Hence the fifth parameterto
look for is its Debt-to-Net Profit Ratio.

How can you be absolutely sure if a company's financialtrack record is
great or not?

A company that has been growing its EPS, Net Sales and BVPS by 12%+
year-on-year ; has a ROIC of over 12% every year ; and can pay off its
debt in less than 3 years i.e. a Debt-to-Net Profit ratio of3 or less
– has a great Financial Track Record. Companies meeting this gold
standard are wonderful companies worth short listing.
Such companies are quite likely to have a moat – a sustainable
competitive advantage, which has allowed it to post great numbers. So,
now you know how important these 5 parameters are!

ChiragCM

--
Thanks
------------
ChiragCM.

Tuesday, January 10, 2012

Few Thoughts On TA

The Technical analysis is a methodology to assist you in deciding the timing of investments, which is very vital to make wise investment decisions. The technical analysis is based on the assumption that history tends to repeat itself in the stock exchange. If a certain pattern of activity has in the past produced certain results nine out of ten, one can assume a strong likelihood of the same outcome whenever this pattern appears in the future. However technical analysis lacks a strictly logical explanation. Technical Analysis is the study of the internal stock exchange information and not of those external factors which are reflected in the stock market. All the relevant factors, whatever they may be can be reduced to the volume of the stock exchange transactions and the level of share price or more generally, the sum of the statistical information produced by the market. Few of the most commonly used technical analysis methods for share market Trading are Japanese Candlestick (most powerful stock charting method), Price Curves, Trend Lines, High Low Charts and Moving averages.

Identifying trends and trading ranges is one of the hardest tasks in technical analysis. It is easy to find them in the middle of a chart, but the closer you get to the right edge, the harder it gets.


Thanks.
-------------
Chirag CM